.webp)

Crypto markets don't move randomly. They follow cycles. While no two cycles are exactly the same, broad patterns repeat often enough that traders have developed solid indicators to identify where the market is in its cycle. In this article, we’ll cover how these signals can give you a clearer picture of the whole crypto market.
Before exploring what early crypto market cycles look like, it helps to understand the indicators people use to spot them. These fall into a few main categories.
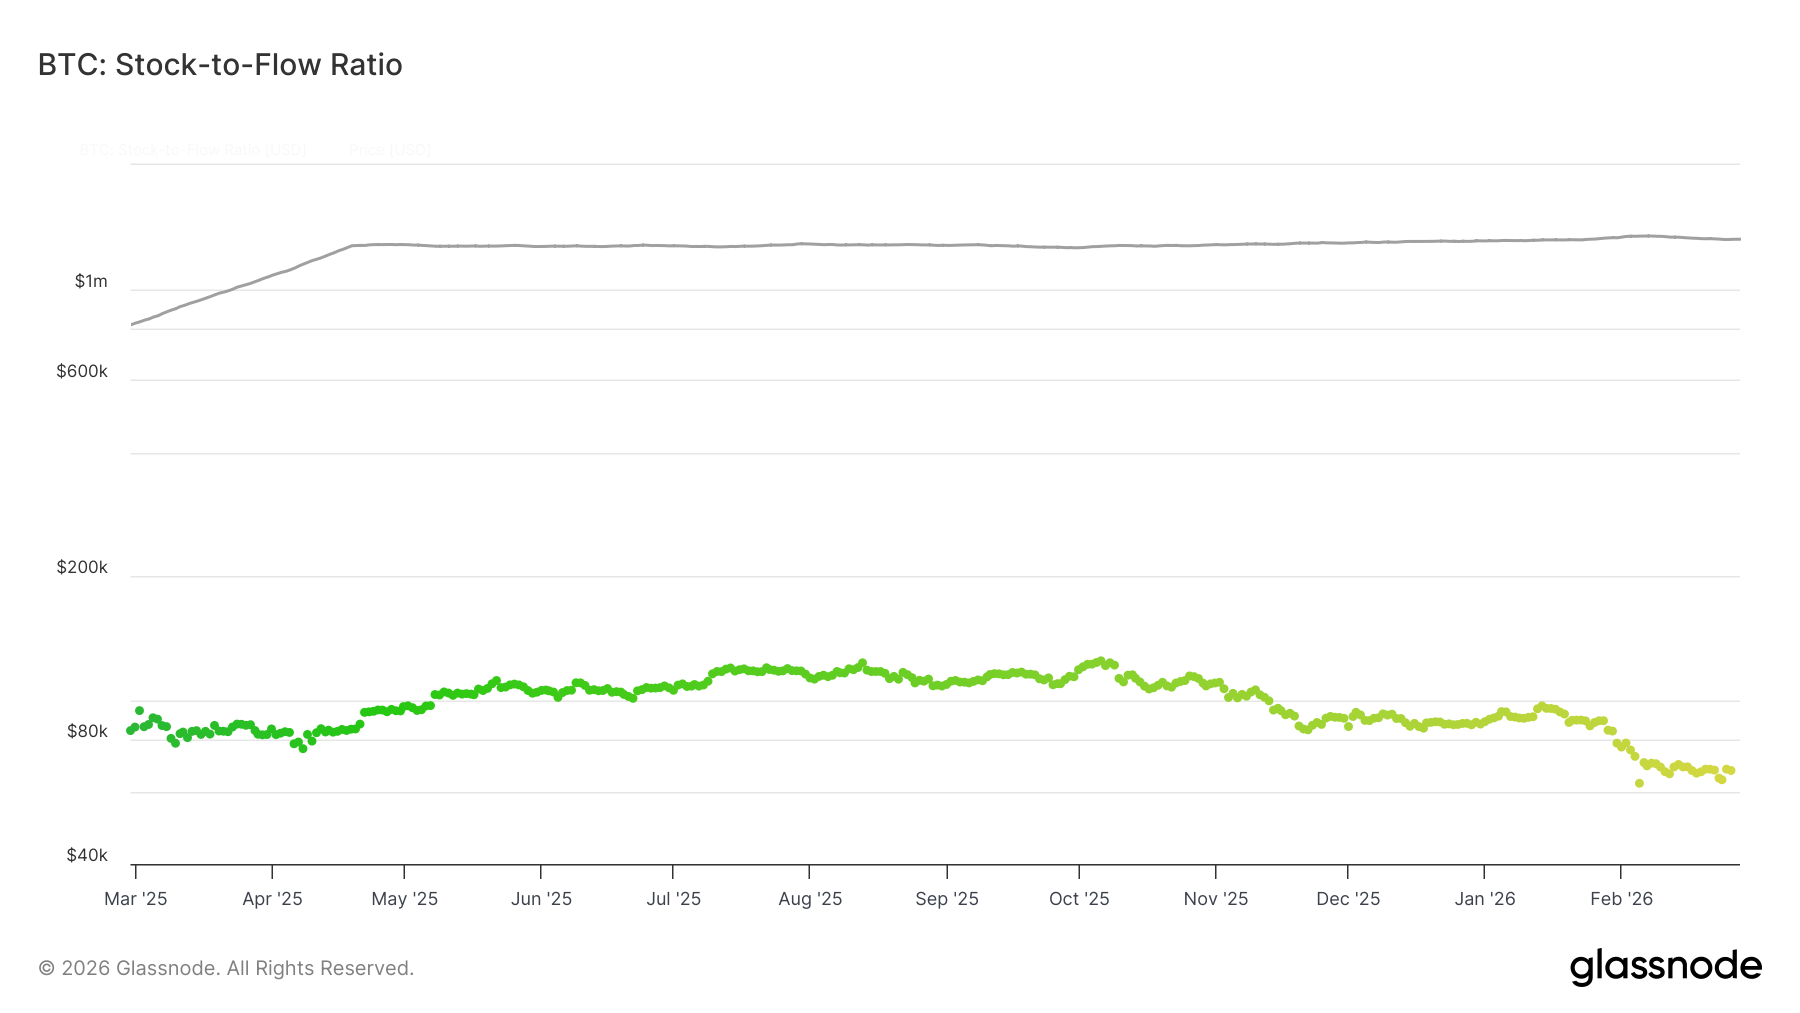
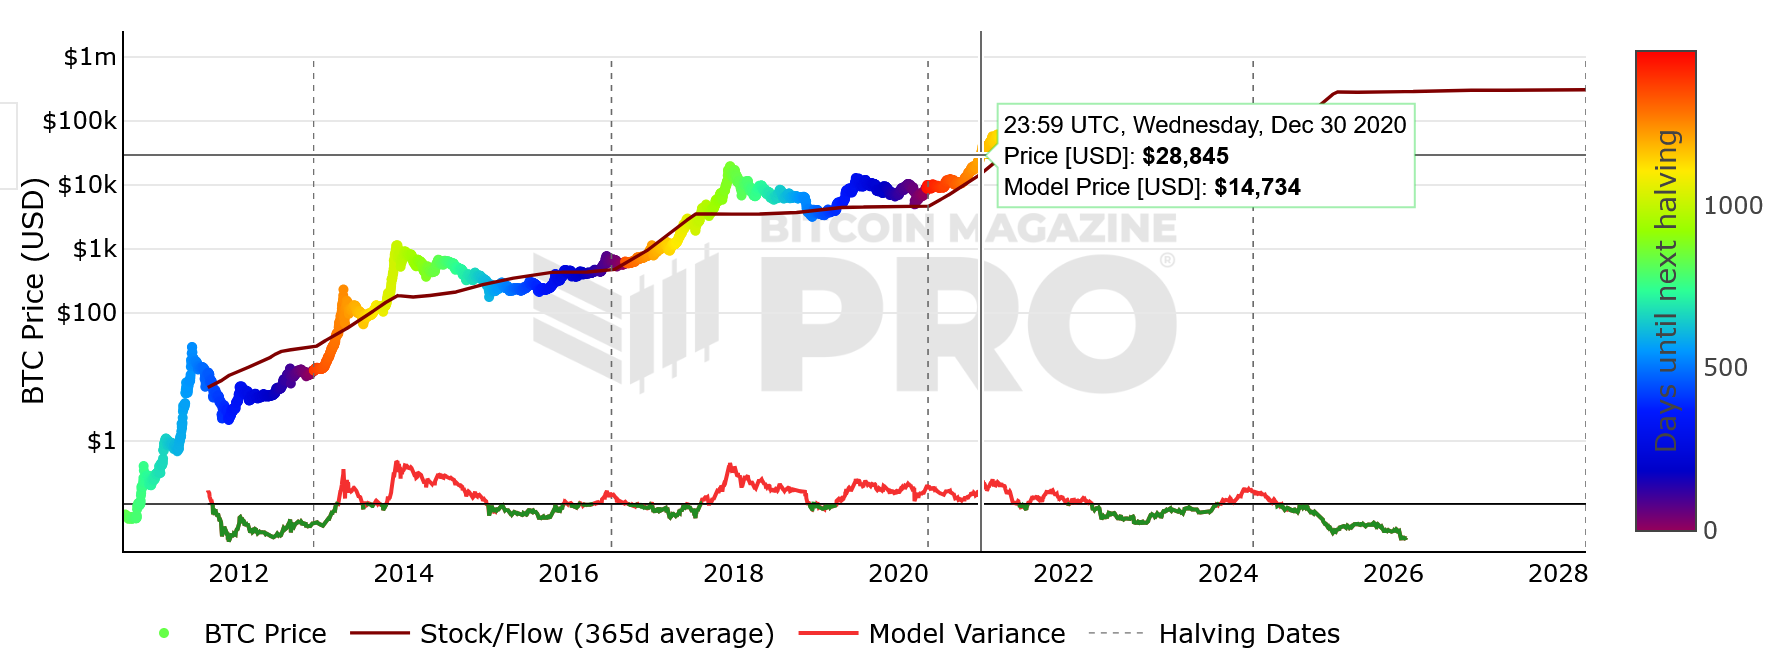
The Bitcoin stock-to-flow (S2F) model estimates Bitcoin's price based on scarcity. It does this by calculating the ratio between the total existing supply of Bitcoin (the "stock") and the amount of new Bitcoin being produced through mining each year (the "flow").
The model treats Bitcoin like commodities such as gold, silver, or platinum. These assets hold value over long timeframes partly because their supply can't be rapidly expanded. Bitcoin is unique because its future supply schedule is written directly into its code. Every 210,000 blocks, roughly every four years, the reward miners receive for validating transactions is cut in half. This is known as Bitcoin halving. Each halving reduces the rate of new supply, increasing the stock-to-flow ratio and suggesting upward price pressure over time.
On S2F charts, the model projects a price line based on this supply dynamic, with colored dots on Bitcoin's actual price line showing how many days remain until the next halving. Bitcoin's price has broadly followed this projected line across multiple cycles, though the model's predictive accuracy has weakened in recent years as market structure grew more complex. Many analysts now treat it more as a historical reference than a standalone forecasting tool. It doesn't account for demand, macro liquidity, or shifts in investor behavior. But as one piece of the puzzle, it still provides useful context around supply-side dynamics.
Fibonacci retracement is a tool borrowed from traditional technical analysis and used heavily in crypto trading. The Fibonacci sequence traces back to Italian mathematician Leonardo Fibonacci, who introduced it in 1202. The sequence works by adding the two preceding numbers: 0, 1, 1, 2, 3, 5, 8, 13, 21, and so on. As the numbers grow larger, the ratio between any consecutive pair approaches 1.618, known as the Golden Ratio.
In trading, these mathematical relationships become horizontal levels drawn on price charts. The key retracement levels are 23.6%, 38.2%, 50%, 61.8%, and 78.6%. Traders draw these levels between a significant price high and low to identify where the price might pause, bounce, or reverse during a pullback.
In a bull market, Bitcoin pulling back to the 38.2% or 61.8% retracement level during a correction is often a buying opportunity. In a bear market, these levels can act as resistance, where price struggles to reclaim lost ground. Fibonacci extensions, calculated from the same number string, project potential price targets above a previous high during price discovery. Common extension levels include 161.8%, 200%, and 261.8%.
For bear market analysis, analysts look at how deeply Bitcoin falls relative to Fibonacci retracement levels drawn from a cycle high. In past bear markets, Bitcoin has historically bottomed below the 0.618 retracement of the prior bull run. The exact depth has varied, but the 0.618 level has consistently served as a key reference point.
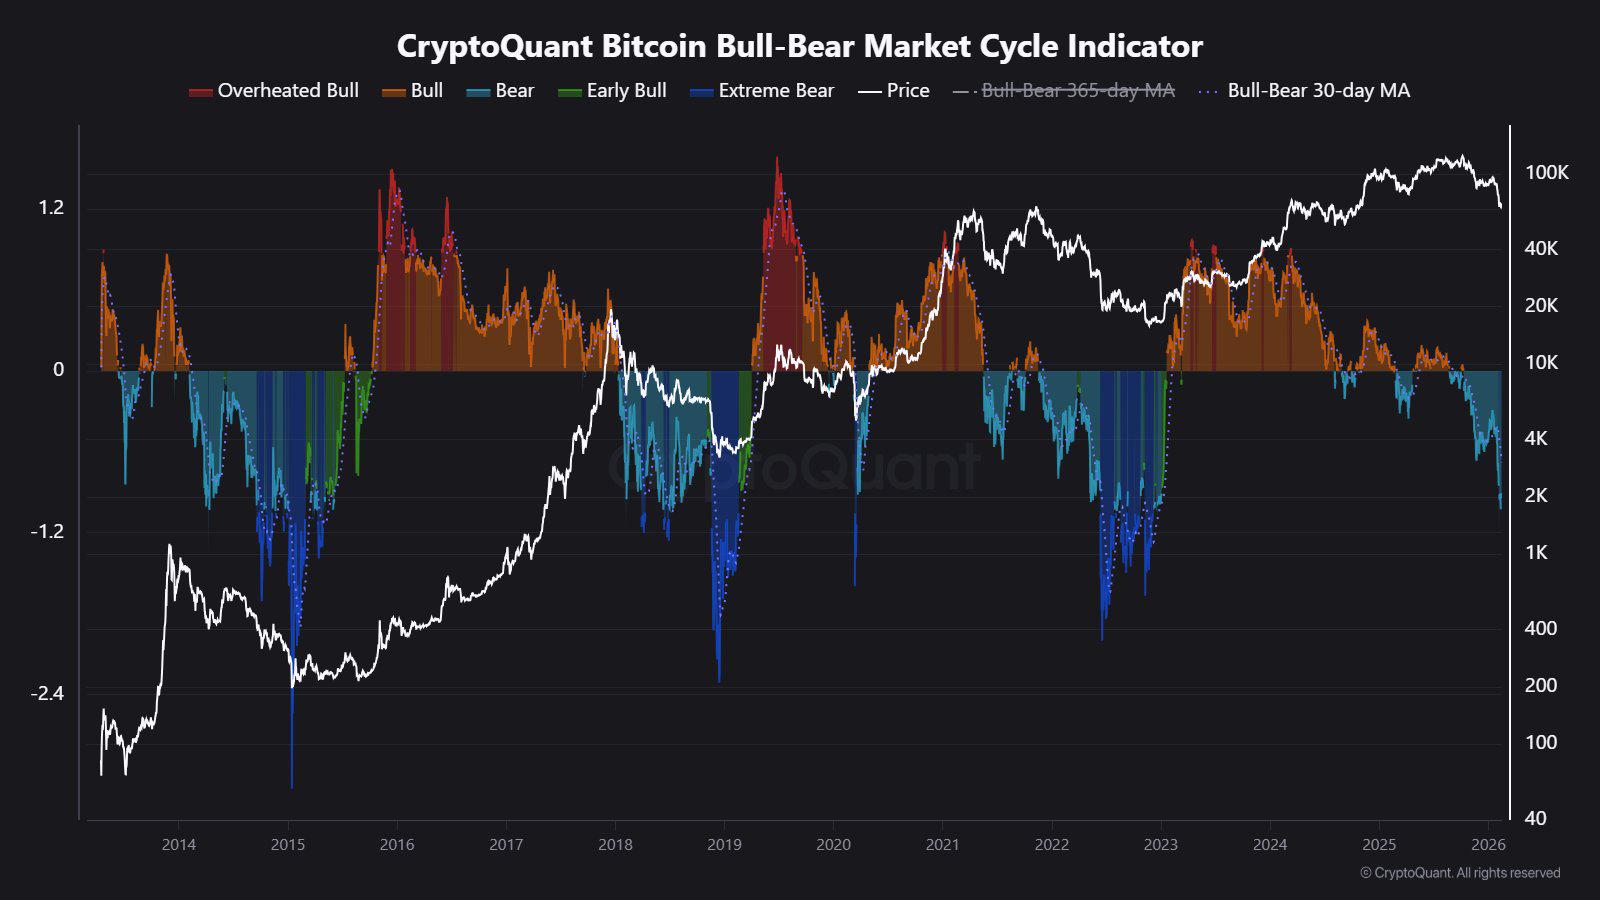
The Bull-Bear Market Cycle Indicator is built on a CryptoQuant metric called the P&L Index, which combines three on-chain indicators: the MVRV Ratio, NUPL, and LTH/STH SOPR.
The MVRV Ratio and NUPL measure unrealized network profit and loss. They compare what Bitcoin is currently worth in the market to what investors originally paid. The LTH/STH SOPR tracks whether long-term and short-term holders are realizing gains or losses through their transactions.
Together, these three feed into the P&L Index, which is compared against its 365-day moving average. When the P&L Index breaks above its 365-day MA, the indicator signals a shift into bullish conditions. When it drops below, the signal flips bearish. This indicator tracks the distance between the two to show how extreme the current market phase is. Deep positive readings suggest a bull market peak. Deep negative readings suggest a bear market bottom.
This is a useful tool because it doesn't just measure price. It measures the financial reality Bitcoin holders are experiencing.
On-chain data refers to information recorded directly on the Bitcoin blockchain. Because Bitcoin's transaction history is public, analysts can extract a remarkable amount of behavioral data about how investors are actually moving and holding their coins.
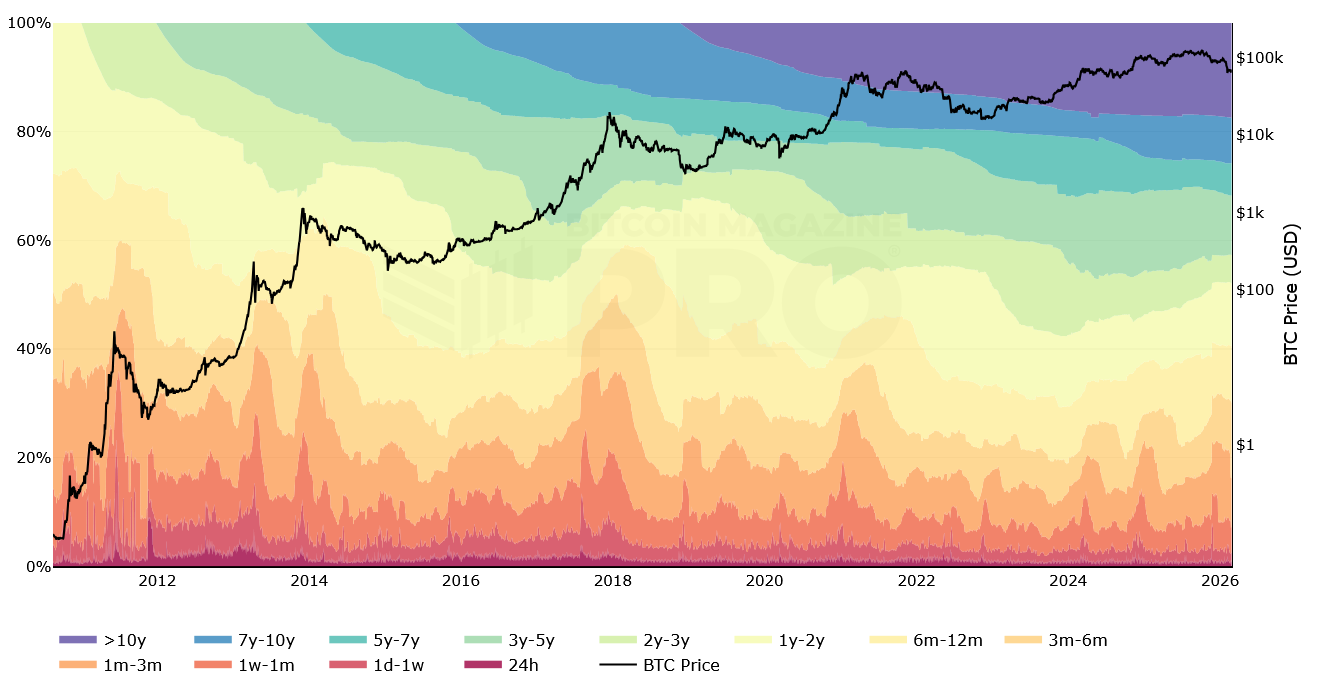
Key on-chain metrics for cycle analysis include exchange flows, which track whether Bitcoin is moving onto exchanges (often a sell signal) or leaving them (often a hold or accumulation signal). Whale behavior, tracked through large-entity transaction data, reveals whether sophisticated participants are buying or reducing exposure. HODL Waves show the distribution of Bitcoin by how long each coin has been in a wallet, indicating whether long-term holders are distributing or accumulating.
Together, on-chain data provides a window into market behavior that price charts alone can't offer.
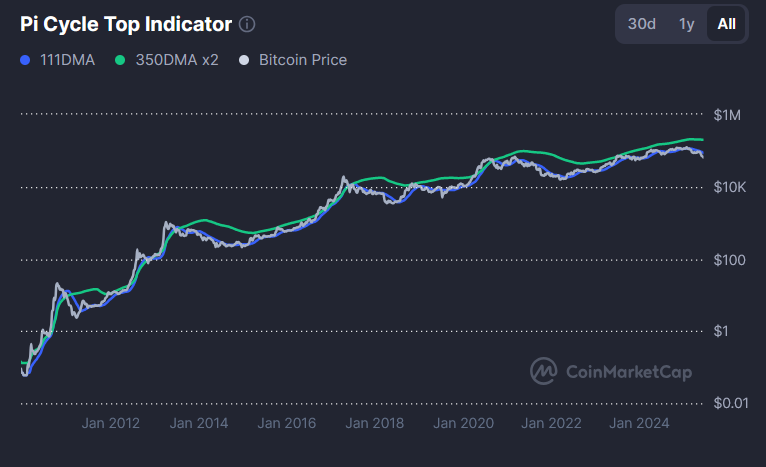
Beyond Bitcoin-specific tools, there are several broader market cycle indicators that platforms like CoinMarketCap aggregate together. These include the Pi Cycle Top Indicator, the Puell Multiple, and the Bitcoin Rainbow Chart.
The Pi Cycle Top uses two specific moving averages of Bitcoin's price. When the shorter crosses above the longer, it has historically marked the top of bull market cycles with notable accuracy. The Puell Multiple looks at the daily value of newly mined Bitcoin relative to its 365-day moving average, helping identify periods when miner revenue is unusually high or low relative to historical norms.
The philosophy behind combining these is sound: no single indicator is reliable alone. But when several flash the same signal simultaneously, that convergence carries more weight.
The early stages of a bull market are often hardest to recognize in real time. Prices are typically well below previous all-time highs, sentiment is cautious, and mainstream coverage is minimal.
On charts, a few patterns appear during early bull market conditions. Bitcoin begins reclaiming its 200-week moving average after spending extended time below it. This level has historically coincided with generational buying opportunities. The P&L Index crosses back above its 365-day MA, generating a positive signal on the Bull-Bear Market Cycle Indicator. On-chain data shows a gradual uptick in new wallet addresses and rising exchange outflows, suggesting more people are moving Bitcoin off exchanges into self-custody.
The stock-to-flow model is interesting to watch around halving events. In the months after a halving, Bitcoin's actual price typically moves below the S2F model line before gradually catching up and surpassing it, which historically aligns with bull market acceleration phases.
Fibonacci levels play a role here too. Reclaiming the 0.618 retracement of the previous cycle's decline from below is often a clear technical signal that the downtrend is over and a new phase has begun.
In March 2020, Bitcoin was trading around $4,000 after a severe COVID-19-related market crash. At that point, the Bull-Bear Cycle Indicator was deeply negative. On-chain data showed long-term holders were accumulating steadily rather than selling. Exchange balances were declining. The 200-week moving average held as support.
By late 2020, with the post-halving supply reduction in effect and institutional interest building, Bitcoin broke above its previous all-time high of around $20,000 set in 2017. The P&L Index crossed decisively above its 365-day MA. The S2F model line was tracked closely by price. From there, the move continued to $69,000 by November 2021. Multiple Fibonacci extension levels from the 2020 low to the 2021 high were hit sequentially throughout the run.
Early bear market signals are easy to miss because they look like ordinary corrections at first.
One of the first signs is a breakdown of the Bull-Bear Cycle Indicator into negative territory. Another is a shift in on-chain data, particularly new investor inflows turning negative. In bull markets, price dips attract fresh capital. In early bear markets, those dips go unabsorbed because new participants do not enter the market in meaningful numbers.
Fibonacci retracement is useful here too. If Bitcoin breaks below the 0.618 retracement of its bull run from a meaningful bottom, analysts measure how far below that level the price might extend. Past cycle bottoms have formed between 30% and 64% below the 0.618 level, depending on the cycle.
Exchange flow data shifts as well. Where outflows dominate during accumulation phases, exchange inflows rise as participants sell. Whale behavior sometimes tells a conflicting story as they hoard crypto even if broader conditions remain weak. This divergence between smart money behavior and overall market sentiment is worth watching.
The bear market following the 2021 peak is well-documented. After Bitcoin hit $69,000 in November 2021, it declined to around $15,500 by November 2022 following the collapse of the FTX exchange. This was roughly a 77% drawdown.

The Bull-Bear Cycle Indicator broke below its 365-day MA in early 2022 and continued falling throughout the year. New investor inflows turned deeply negative. The Fibonacci 0.618 retracement of the 2020 to 2021 cycle, measured from the March 2020 low to the November 2021 high, was around $29,000. Bitcoin broke decisively below that level in May 2022 during the LUNA collapse and never recovered it during the bear market. The eventual bottom near $15,500 came about 46% below the 0.618 level, consistent with the pattern of progressively moderating bear market lows across cycles.
Whale accumulation data during this period is instructive. Even as Bitcoin was bottoming, on-chain data showed large entities quietly moving coins off exchanges into long-term storage. That pattern, mirroring behavior seen in previous cycle bottoms, was an early signal the distribution phase was ending. However, as the 2022 to 2023 cycle showed, accumulation by whales does not guarantee an immediate price recovery, as the broader recovery didn't take hold until early 2023.
The truth about these tools is that none work reliably in isolation. The stock-to-flow model has been wrong for extended periods. Fibonacci levels are only as meaningful as the price action around them. The Bull-Bear Cycle Indicator can sit in extreme territory for months before a reversal appears.
When you layer them together, the picture gets clearer. A deeply negative Bull-Bear Cycle Indicator, combined with negative new investor inflows, Bitcoin trading below the 0.618 Fibonacci retracement of the prior bull run, and whale accumulation patterns matching previous cycle bottoms, tells a more coherent story than any single metric could.
The cycle framework isn't a crystal ball. It provides a structured way to think about where you might be in the market, and that context is worth a lot.
With deep roots in traditional finance and the digital asset industry, Acquire.Fi operates as a specialist M&A advisory firm. Coverage spans M&A, secondaries, OTC, and capital markets advisory across digital assets and frontier tech. Decades of combined experience across every stage of the deal lifecycle.


.webp)