.webp)

Cryptocurrency markets are known for their wild price swings, from rapid bull runs to sharp drops. These movements follow market cycles; patterns shaped by human behavior, supply and demand, technology, and the wider economy. Unlike traditional markets where cycles take years, crypto cycles happen much faster, often squeezing years into just months.
There’s no set length for a cycle, but many experts notice patterns happening about every four years. These often line up with events like Bitcoin’s halving, when the amount of new Bitcoin entering the market is cut in half.
Market cycles happen mainly because emotions influence prices more than logic. When prices go up, optimism spreads quickly. Early gains bring in more buyers, creating a cycle that pushes prices even higher. This excitement often leads to overvalued assets as fear of missing out (FOMO) takes over careful thinking.
The shift from optimism to panic is just as sudden. When prices start to drop, confidence turns into doubt, then fear, and finally giving up. Many investors who bought near the top sell at big losses, which often creates the bottom that more patient buyers look for to start accumulating again.
Institutional investors usually act differently than retail traders. Big players often buy when fear is highest and prices have settled low, preparing for the next cycle. They sell slowly as excitement grows, taking profits without chasing the hype. Retail investors, on the other hand, often jump in late during bull runs and panic-sell during crashes, ending up buying high and selling low.
This emotional cycle keeps repeating because new people join the market each time. Those who lived through past crashes often quit or wait until confidence comes back. Newcomers, without experience of past losses, tend to make the same mistakes, keeping the cycle going. The mix of seasoned holders and first-timers adds to the volatility that makes crypto markets so unpredictable.
The crypto market cycle has four main stages: Accumulation, Markup, Distribution, and Markdown. These are like stages in traditional markets, but crypto’s high volatility and unique factors make these cycles more intense and sometimes harder to predict.
The accumulation phase starts a new market cycle after a long downturn has worn out sellers. Prices stay fairly steady but low, close to the bottom set by the previous crash. Trading volume is low because many traders are doubtful or have left the market.
This phase usually lasts 12 to 15 months, but it can change depending on how bad the last crash was and the overall economy. The market feels weak and uncertain, with small price changes that don’t build momentum. Negative feelings dominate conversations, and media coverage is either missing or focused on the earlier crash.
This phase is marked by a quiet shift of assets from discouraged sellers to patient buyers. Long-term holders who stayed confident during the downturn often give up near the bottom, selling at losses they can’t handle. At the same time, experienced investors and institutions slowly buy at good prices. They spread out their purchases over weeks or months to avoid pushing prices up.
During accumulation, the market feels tired and resigned. People still interested in crypto have stopped guessing when it will recover. This lack of excitement often means the bottom is in. When no one talks about an asset and pessimism seems permanent, that’s usually when “smart money” starts preparing for the next rise.
The markup phase, often called a bull market, is when cryptocurrency prices rise steadily and significantly. It usually starts before the Bitcoin halving and can last 12 to 18 months after, though recent cycles have varied. During this phase, feelings change from cautious to optimistic to excited as prices go up.
At the start of this phase, prices rise slowly as confidence comes back. Bitcoin usually leads the way, while altcoins catch up later. As the markup grows, prices speed up. New record highs get media attention, bringing in new investors who missed the accumulation phase. This fresh money pushes prices even higher in a cycle that feeds itself.
Trading volume jumps during markup as many more people join in. Retail investors come back, often borrowing money to increase their bets. Fear of missing out takes over, pushing caution aside even when prices get very high. Some projects with little real value can skyrocket just because money moves freely and buyers don’t look closely.
Distribution is the shift from rising prices to a standstill as the market hits a peak. Early investors and experienced traders start taking profits, while newer buyers keep buying, thinking the rally will continue. This causes a tug-of-war between buyers and sellers, leading to choppy, sideways price movement.
The psychological change during distribution is subtle but important. Some people feel the peak is close, while others believe prices will keep rising. Trading volume stays high as buying and selling increase, but prices don’t move clearly up or down. This sideways action can last weeks or months, frustrating both buyers hoping for gains and sellers waiting for a clear top.
During distribution, technical indicators often show mixed signals. Prices might hit slightly higher highs, but momentum indicators don’t back this up, hinting at weakening confidence. On-chain data shows long-term holders moving coins to exchanges to sell, while newer investors buy at high prices.
The distribution phase is tough for traders because it feels uncertain. Unlike the clear trends in accumulation or markup, distribution sends mixed signals. Some days have strong rallies that look like the bull market is still on. Other days see sharp drops that quickly reverse, shaking out weaker traders while smart investors slowly sell their positions.
Historically, distribution phases are shorter than accumulation phases, usually lasting a few months instead of a year or more. The move from distribution to markdown can happen quickly, often triggered by things like bad news, a failed price level, or a lack of new buyers.
The markdown phase, or bear market, is the toughest time emotionally for most crypto investors. Prices fall sharply and keep dropping, wiping out months of gains in just weeks. This phase often ends with capitulation, when even long-term holders give up and sell at losses to save what’s left.
Fear takes over during the markdown phase. Media focuses on every failure and scandal, ignoring good news. Trading volume spikes during sharp drops as panic selling floods the market, then falls to very low levels as people leave. Watching their portfolios shrink causes many retail investors to quit for good.
Altcoins usually fall even harder during markdowns. Many lose 90-95% of their value, and projects with weak foundations or just speculation might never bounce back. This harsh process weeds out weaker projects and tests those with real value and strong communities.
Short sellers make money during markdowns by betting that prices will fall. As the downward trend grows, technical traders take more short positions, adding selling pressure that speeds up the drop. Forced sales of leveraged long positions also push prices down faster, especially during quick crashes.
The markdown phase ends when selling slows down. Prices settle at levels that attract buyers ready to start accumulating again, usually when pessimism is at its peak. This shift from markdown back to accumulation finishes the cycle and prepares the market for the next markup phase.
Each cycle is different in timing and size, but some historic examples show these four phases clearly:

In this cycle, Bitcoin rose from about $1 to over $1,100 before crashing 85% down to $150 by early 2015. This set the pattern for later cycles, though the amounts were small compared to what came after. The accumulation phase lasted most of 2015, with prices holding steady between $200 and $300.
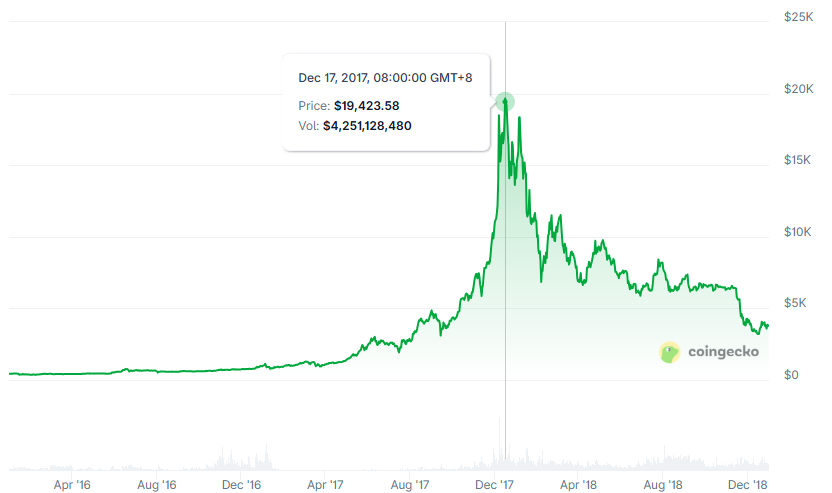
The 2016-2018 cycle showed this pattern on a bigger scale. Bitcoin was around $1,000 in 2016 and shot up to nearly $20,000 by December 2017, fueled by retail excitement and the initial coin offering (ICO) boom. Altcoins rose even more dramatically, with some gaining thousands of percent. The crash in 2018, called "crypto winter," dropped Bitcoin to $3,200 and wiped out most altcoin values. Accumulation lasted through most of 2019, with distribution in mid-2019 before another drop.

The 2019-2022 cycle followed the usual pattern but included institutional investors, which earlier cycles didn’t have. Bitcoin’s markup started in late 2020, sped up through 2021, and peaked at $69,000 in November 2021. The distribution phase was short, and markdown began in early 2022. Prices dropped steadily through 2022, hitting lows near $15,500 in November. This cycle had smaller percentage drops than before, possibly because institutions bought during the decline instead of panicking.

The current cycle, starting in 2023, has some unique features. Bitcoin’s markup began earlier than in past cycles compared to the April 2024 halving, helped by spot crypto ETF approvals in January 2024. Bitcoin hit new all-time highs before the halving instead of 12-18 months after, as before. This early move has made some analysts wonder if the usual four-year cycle still applies or if institutions have changed the market’s behavior.
Many factors influence cryptocurrency market cycles, coming from inside the crypto world and from the wider economy.
Bitcoin’s halving events, which cut miner rewards about every four years, affect the market’s supply. Historically, these events have led to long price increases because less new supply meets steady or growing demand.
Bitcoin dominance is important since it makes up about 58% of the total market value. When Bitcoin moves up or down, most altcoins follow. This link means that knowing Bitcoin’s cycle often helps predict the wider market’s direction.
Sentiment tools like the Fear & Greed Index try to measure how traders feel about the market. High greed usually happens near market peaks, while extreme fear can signal that prices are low and might bounce back.
Social media and influential people add more complexity. One tweet from a well-known entrepreneur, hype from crypto influencers, or support from a big company can move markets a lot, especially for smaller assets. This sensitivity to social sentiment adds extra volatility beyond basic factors.
Central bank interest rates affect how much investors want risky assets like cryptocurrencies. When rates go up to fight inflation, money moves away from risky investments to safer bonds and savings. When rates are low and central banks ease money supply, investors look for higher-risk, higher-reward assets. Since 2020, the link between global liquidity and Bitcoin’s price has grown stronger.
Clear positive regulations, like the approval of Bitcoin ETFs in January 2024, attracted institutional money and helped push prices to new highs before the halving. Negative actions, like government crackdowns or exchange failures, cause fear and selling that can last for months.
Technological progress in crypto also affects cycles. Big upgrades, smooth network changes, or new breakthrough apps can spark interest during slow times. On the other hand, major hacks, network problems, or security flaws can make downturns last longer than supply and demand would suggest.
All these factors work together in complex ways, making it hard to time the market but offering important strategic opportunities for participants.
Technical analysis offers tools and crypto charts to spot which market cycle phase is happening. No single crypto market indicator is perfect, but using several together helps traders understand where they are in the bigger cycle.
Moving averages are still some of the most reliable trend tools. The 111-day simple moving average and twice the 350-day simple moving average make up the Pi Cycle Top indicator. Historically, when the 111-day average crosses above twice the 350-day average, Bitcoin is near a cycle top. This indicator correctly predicted tops in 2013, 2017, and signaled in April 2021, though it missed the November 2021 peak.
Volume analysis shows how strong price moves are. In markup phases, volume usually rises on up days and falls on pullbacks, confirming the uptrend. During distribution, volume stays high but prices don’t move much, showing balance between buyers and sellers. In markdown phases, volume spikes on down days as fear causes selling.
The Puell Multiple divides daily Bitcoin issuance value by its 365-day average to show miner profits and possible capitulation points. Low values mean miners are selling at prices they can’t sustain, often near cycle bottoms. High values show strong miner profits, which can come before distribution phases when miners take profits.
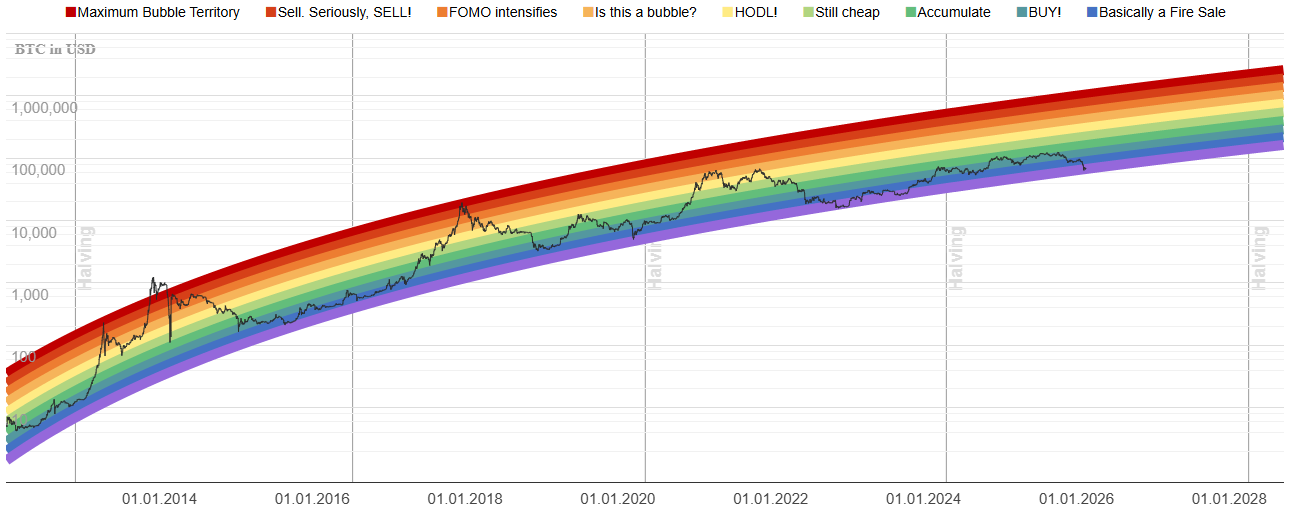
Another helpful tool is the Bitcoin Rainbow Chart, which uses logarithmic regression to show long-term price trends and possible over- or undervaluation. It divides prices into color bands from "fire sale" at the bottom to "maximum bubble territory" at the top. While it’s not exact for timing, it helps show if prices are cheap or expensive compared to history.
The Crypto Fear and Greed Index combines data like volatility, market momentum, social media sentiment, and Bitcoin dominance into a score from 0 to 100. Scores below 20 show extreme fear, common in accumulation and markdown phases. Scores above 80 indicate extreme greed, typical in late markup and distribution. This index helps traders see if emotions are pushing markets to unsustainable levels.
The Relative Strength Index (RSI) and MACD give momentum signals that help confirm trend changes. When price and these indicators don’t match, it often signals a reversal. For example, if Bitcoin hits new highs but RSI doesn’t, it suggests weakening momentum and may signal a shift from markup to distribution.
With deep roots in traditional finance and the digital asset industry, Acquire.Fi operates as a specialist M&A advisory firm. Coverage spans M&A, secondaries, OTC, and capital markets advisory across digital assets and frontier tech. Decades of combined experience across every stage of the deal lifecycle.


.webp)